


New Freight Benchmark Shows Value and Weight of Goods Moved on America’s Transportation Network Rose Over a Five-Year Period |
|---|

|
Federal Highway Administration
26 February 2021
BTS 14-21
FHWA 05-21
Contact: BTS/Dave Smallen (202) 366-5568, david.smallen@dot.gov
FHWA/Nancy Singer (202) 366-0660, nancy.singer@dot.gov
Note: Value comparisons are in current dollars.
Source: Bureau of Transportation Statistics and Federal Highway Administration, Freight Analysis Framework version 5.0.
Goods moved on America’s transportation network rose in value and tonnage from 2012 to 2017, according to the latest version of the Freight Analysis Framework (FAF5), the most comprehensive publicly available dataset of freight movement, jointly released today by the U.S. Department of Transportation's Federal Highway Administration (FHWA) and Bureau of Transportation Statistics (BTS).
FAF benchmarks are released at five-year intervals. Starting with data from BTS’ Commodity Flow Survey (CFS) and international trade data from the Census Bureau, FAF incorporates data from agriculture, extraction, utility, construction, service, and other sectors. The most recent CFS data were collected in 2017 which is the benchmark year for FAF5. FAF numbers in this release represent total freight flows within the U.S. including domestic movement of imports and exports.
Annual FAF estimates of 2020 freight flows are planned for later in 2021 and will account for changes that have taken place during the COVID-19 pandemic.
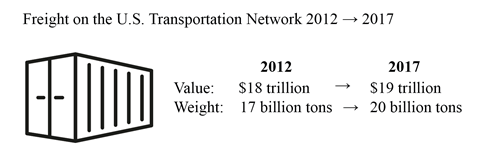
The newly updated FAF5 estimates show that nearly 20 billion tons of goods worth almost $19 trillion were moved on the U.S. transportation network in 2017. The annual numbers mean that on average 54 million tons of goods valued at $52 billion a day moved throughout the country on all transportation modes. Value comparisons are in current dollars.
In comparison, in the full year 2012, nearly 17 billion tons of goods worth about $18 trillion were moved, which equates to 46 million tons of goods valued at more than $48 billion per day.
Trucks remain the most commonly used mode to move freight, transporting 64% of the weight (12.7 billion tons) and 72% of the value ($13.7 trillion) in 2017 (Figure 1).
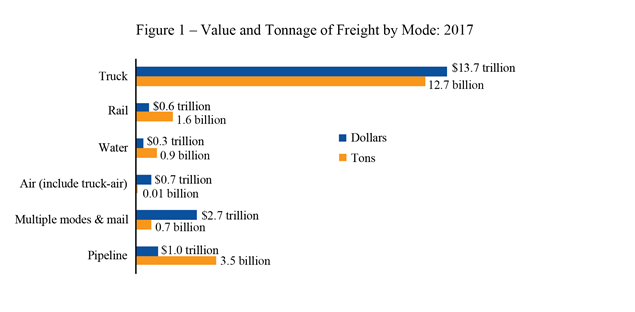
Source: Bureau of Transportation Statistics and Federal Highway Administration, Freight Analysis Framework version 5.0.
The busiest freight corridors are located between major cities. For example, the total value of bi-directional freight flows transported between the Los Angeles and San Francisco metropolitan areas, the busiest corridor, reached $200 billion in 2017 or 1.1% of the national total (Figure 2).
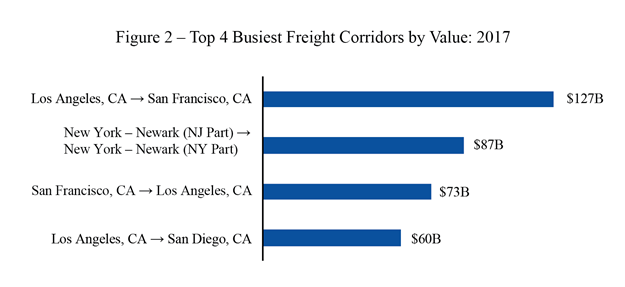
Note: Based on shipments between FAF regions.
Source: Bureau of Transportation Statistics and Federal Highway Administration, Freight Analysis Framework version 5.0.
FAF includes data on the amount and types of goods that move by land, sea and air between large metropolitan areas, states and regions. It is designed to provide information on national level freight flows across America's transportation network. These data help people in the public and private sectors better understand freight movement, and aid transportation planners in targeting resources to improve operations or increase capacity.
Fifty states plus the District of Columbia have developed state freight plans. The FAF data was used by many states to analyze national freight system trends to develop their freight plans. As states begin updating their existing freight plans, FAF5 data will be a valuable resource for identifying needs and key issues confronting the freight system.
Today’s FAF5 product release provides updated 2017 origin and destination FAF data. The 2017 data will be used as a benchmark for the development of additional FAF5 data releases including: annual freight flows estimates for 2018, 2019 and 2020; long-range forecasts through 2050; projections of truck flows on the highway network for 2017 and 2050; and a historical time series.
More detail on FAF is available from BTS and FHWA.
# # #