


Controlled Substances and Alcohol Testing Management Information System (MIS) Statistical Data |
|---|
 Topics: Federal Highway Administration
|
Kenneth R. Wykle
January 14, 1998
[Federal Register: January 14, 1998 (Volume 63, Number 9)]
[Rules and Regulations]
[Page 2172-2177]
From the Federal Register Online via GPO Access [wais.access.gpo.gov]
[DOCID:fr14ja98-19]
-----------------------------------------------------------------------
DEPARTMENT OF TRANSPORTATION
Federal Highway Administration
49 CFR Part 382
Controlled Substances and Alcohol Testing Management Information
System (MIS) Statistical Data
AGENCY: Federal Highway Administration (FHWA), DOT.
ACTION: Controlled substances and alcohol testing rates.
-----------------------------------------------------------------------
SUMMARY: The FHWA is announcing the motor carrier industry's 1994,
1995, and 1996 controlled substances and alcohol testing positive
rates. The controlled substances testing positive rate was 2.6 percent
in calendar year 1994, 2.8 percent in 1995, and 2.2 percent in 1996.
The alcohol testing ``violation'' rate was 0.14 percent in 1995, and
0.18 percent in 1996. Because the violation rate was below 0.5 percent
for two consecutive years, the FHWA is announcing it is lowering the
random alcohol testing rate for calendar year 1998 to 10 percent, in
accordance with the provisions of the testing regulations.
DATES: January 1, 1998.
FOR FURTHER INFORMATION CONTACT: Mr. Charles Rombro, Office of Motor
Carrier Information Analysis (HIA-20), (202) 366-5615; Federal Highway
Administration, 400 Seventh Street, SW., Washington, DC 20590.
SUPPLEMENTARY INFORMATION: On December 23, 1993 (58 FR 68220), the FHWA
announced it would require motor carriers subject to 49 CFR part 391,
later replaced by part 382, to implement and maintain specific
controlled substance testing data, and submit an appropriate annual
report when requested. All motor carriers must maintain this
information. The FHWA randomly selects a sample of motor carriers
annually and asks those selected to submit their data.
On February 15, 1994 (59 FR 7484), the FHWA promulgated new
controlled substances and alcohol testing rules in 49 CFR part 382.
These rules combined the controlled substances annual report with a
similar alcohol rule ``violation'' annual report. An alcohol rule
violation for purposes of the annual report are alcohol concentrations
of 0.04 or greater and refusals to submit to alcohol testing.
On March 13, 1995, the FHWA amended the rule to reduce the
information collection burden on all respondents, including small
entities (60 FR 13369).
The current rule at Sec. 382.403, formerly at 49 CFR 391.87(h), is
essential for the FHWA to accomplish the following four goals.
1. Collect controlled substance and alcohol testing statistical
data.
2. Use the data to analyze its current approach to deterring and
detecting illegal controlled substance abuse and alcohol misuse in the
motor carrier industry.
3. Determine each calendar year's random selection rates for
alcohol and controlled substance testing under the rule.
4. Provide for a more efficient and effective regulatory program.
In 1995, the FHWA requested a sample of motor carriers report to
the FHWA data collected in 1994. The FHWA determined the random
positive controlled substance testing rate for commercial motor vehicle
(CMV) drivers subject to 49 CFR part 391, subpart H, for the period of
January 1, 1994, through December 31, 1994, was 2.6 percent.
In 1996, the FHWA requested a sample of motor carriers report to
the FHWA data collected in 1995. The FHWA calculated a random positive
controlled substance testing rate--``the positive rate''--for 1995 of
2.8 percent. The 1995 random alcohol violation testing rate--``the
violation rate''--for CDL drivers of motor carriers with 50 or more CDL
drivers was 0.14 percent.
The FHWA performed similar calculations on the 1996 data, based on
forms received from a random sample of carriers in early 1997. The
``positive rate'' for controlled substances was 2.2 percent. For
alcohol, the ``violation rate'' was 0.18 percent. The estimated rates,
with their associated 95 percent confidence intervals, are presented in
Table 1.
The estimation procedures for the 1995 and 1996 rates incorporate
carrier data on drivers refusing to test. Specific definitions for
violation rate and positive rate were added to the regulations during
calendar year 1994 for testing in 1995. Based on these rule changes,
refusals to take a random test are counted as ``positive.'' Adding
refusals slightly increases the rates for alcohol concentrations of
0.04 or greater and verified positive controlled substances tests,
because the number of refusals each year were very small. See the
definitions for ``violation rate'' added on February 15, 1994 (59 FR
7484) and ``positive rate'' added on December 2, 1994 (59 FR 62218).
This results in a higher rate than would be the case if the FHWA
excluded refusals.
Table 1.--Random Testing
----------------------------------------------------------------------------------------------------------------
Calendar Survey rate 95% confidence
year (%) (i nterval (%))
----------------------------------------------------------------------------------------------------------------
Controlled substances.............................................. 1994 2.6 1.9
*1995 2.8 0.9
*1996 2.2 0.8
Alcohol............................................................ *1995 0.14 0.04
[[Page 2173]]
*1996 0.18 0.06
----------------------------------------------------------------------------------------------------------------
* Includes drivers refusing to submit to testing.
The FHWA based the calendar year 1994 rates upon U.S. domiciled
motor carriers subject to 49 CFR part 391, subpart H operating in
interstate commerce. The FHWA based the calendar year 1995 rates upon a
sample from the following population:
1. Small U.S. domiciled interstate motor carriers subject to 49 CFR
part 391, subpart H; and
2. Large U.S. domiciled intrastate or interstate motor carriers
(also known as employers) subject to 49 CFR part 382.
All U.S. domiciled motor carriers became subject to 49 CFR part 382
on January 1, 1996. As a result, the 1996 rates are based on a sample
of all domestic carriers. All foreign domiciled motor carriers (e.g.,
Canadian and Mexican motor carriers) became subject to 49 CFR part 382
on July 1, 1997.
Based upon 49 CFR 382.305 and the results of the survey, the
controlled substances selection and testing rate must remain at 50
percent of the average number of CDL driver positions for calendar year
1998. The controlled substances positive rate must be below 1.0 percent
each year for two consecutive years before the regulations would allow
the FHWA to reduce the selection and testing rate to 25 percent.
The alcohol selection and testing rate will be lowered to 10
percent of the average number of CDL driver positions for calendar year
1998, in accordance with the provisions of 49 CFR 382.305(d)(1). The
FHWA may increase the alcohol selection and testing rate for calendar
year 1999 if the MIS reports received for calendar year 1997 indicate
the alcohol testing violation rate for 1997 is over 0.5 percent.
The provisions of 49 CFR 382.305(d)(1) are as follows:
Sec. 382.305 Random testing.
(d)(1) When the minimum annual percentage rate for random alcohol
testing is 25 percent or more, the FHWA Administrator may lower this
rate to 10 percent of all driver positions if the FHWA Administrator
determines the data received under the reporting requirements of
Sec. 382.403 for two consecutive calendar years indicate the violation
rate is less than 0.5 percent.
Petition
The Truckload Carriers Association (TCA, formerly named the
Interstate Truckload Carriers Conference) petitioned the FHWA
Administrator on October 23, 1996, to reduce the random testing rate
applicable for alcohol and controlled substances testing on behalf of
itself and four of its member motor carriers: C.R. England & Sons,
Inc., Salt Lake City, Utah; Fortune Transportation, Windom, Minnesota;
Roberson Transportation Services, Farmer City, Illinois; and Weinrich
Truckline, Inc., Hinton, Iowa.
The FHWA, as stated above, is reducing the random alcohol testing
rate for calendar year 1998 for all motor carriers subject to 49 CFR
part 382. Thus, this notice partially responds to the TCA petition. The
other part requests a reduction in the random controlled substances
testing rate for only the TCA's named and unnamed members.
As the DOT and the FHWA explained on December 2, 1994 (59 FR 62218,
at 62222), the FHWA will determine changes to the random testing rate
based upon the motor carrier industry as a whole as the triggering
group, not individual motor carriers or industry segments. The DOT and
the FHWA believed then, and continue to believe, this is the fairest
and most effective approach. Basing the testing rate upon the industry-
wide positive rate provides an incentive for motor carriers and groups
of motor carriers with successful programs to pressure problem carriers
and subgroups to improve their performance.
The FHWA, therefore, denies the TCA's petition with respect to
reducing the controlled substances testing for TCA members only.
How Did FHWA Determine These Rates?
The appendices to this notice contain the methods used to analyze
the data and calculate the positive testing rates. The FHWA has
attempted to make the discussion as straightforward as possible while
not slighting any substantive issues or formulas. The FHWA believes a
discussion of the process must be available to the widest available
audience; therefore the statistical methodology and the rates are
provided below.
Will the Reduction of the Random Alcohol Testing Rate Reduce
Highway Safety?
The FHWA does not believe reducing the random alcohol testing rate
to 10 percent will diminish the safe operation of commercial motor
vehicles. First, the rates show the motor carrier industry already has
a very low alcohol violation rate. The FHWA's MIS data indicates the
motor carrier industry is achieving about 99.8 percent alcohol free
drivers.
Second, recent analysis of fatal crash results show CMV drivers
involved in fatal crashes do not have a significant problem with
alcohol while driving CMVs. According to the National Highway Traffic
Safety Administration's (NHTSA) publication, Traffic Safety Facts 1996:
Large Trucks, 1.4 percent of truck drivers driving large trucks
involved in fatal crashes in 1996 were intoxicated. Intoxication rates
for drivers of passenger cars, light trucks, and motorcycles were 18.8
percent, 21.9 percent, and 30.3 percent, respectively. Rates for these
other drivers are 13 to 21 times higher than the intoxication rate for
drivers of large trucks.
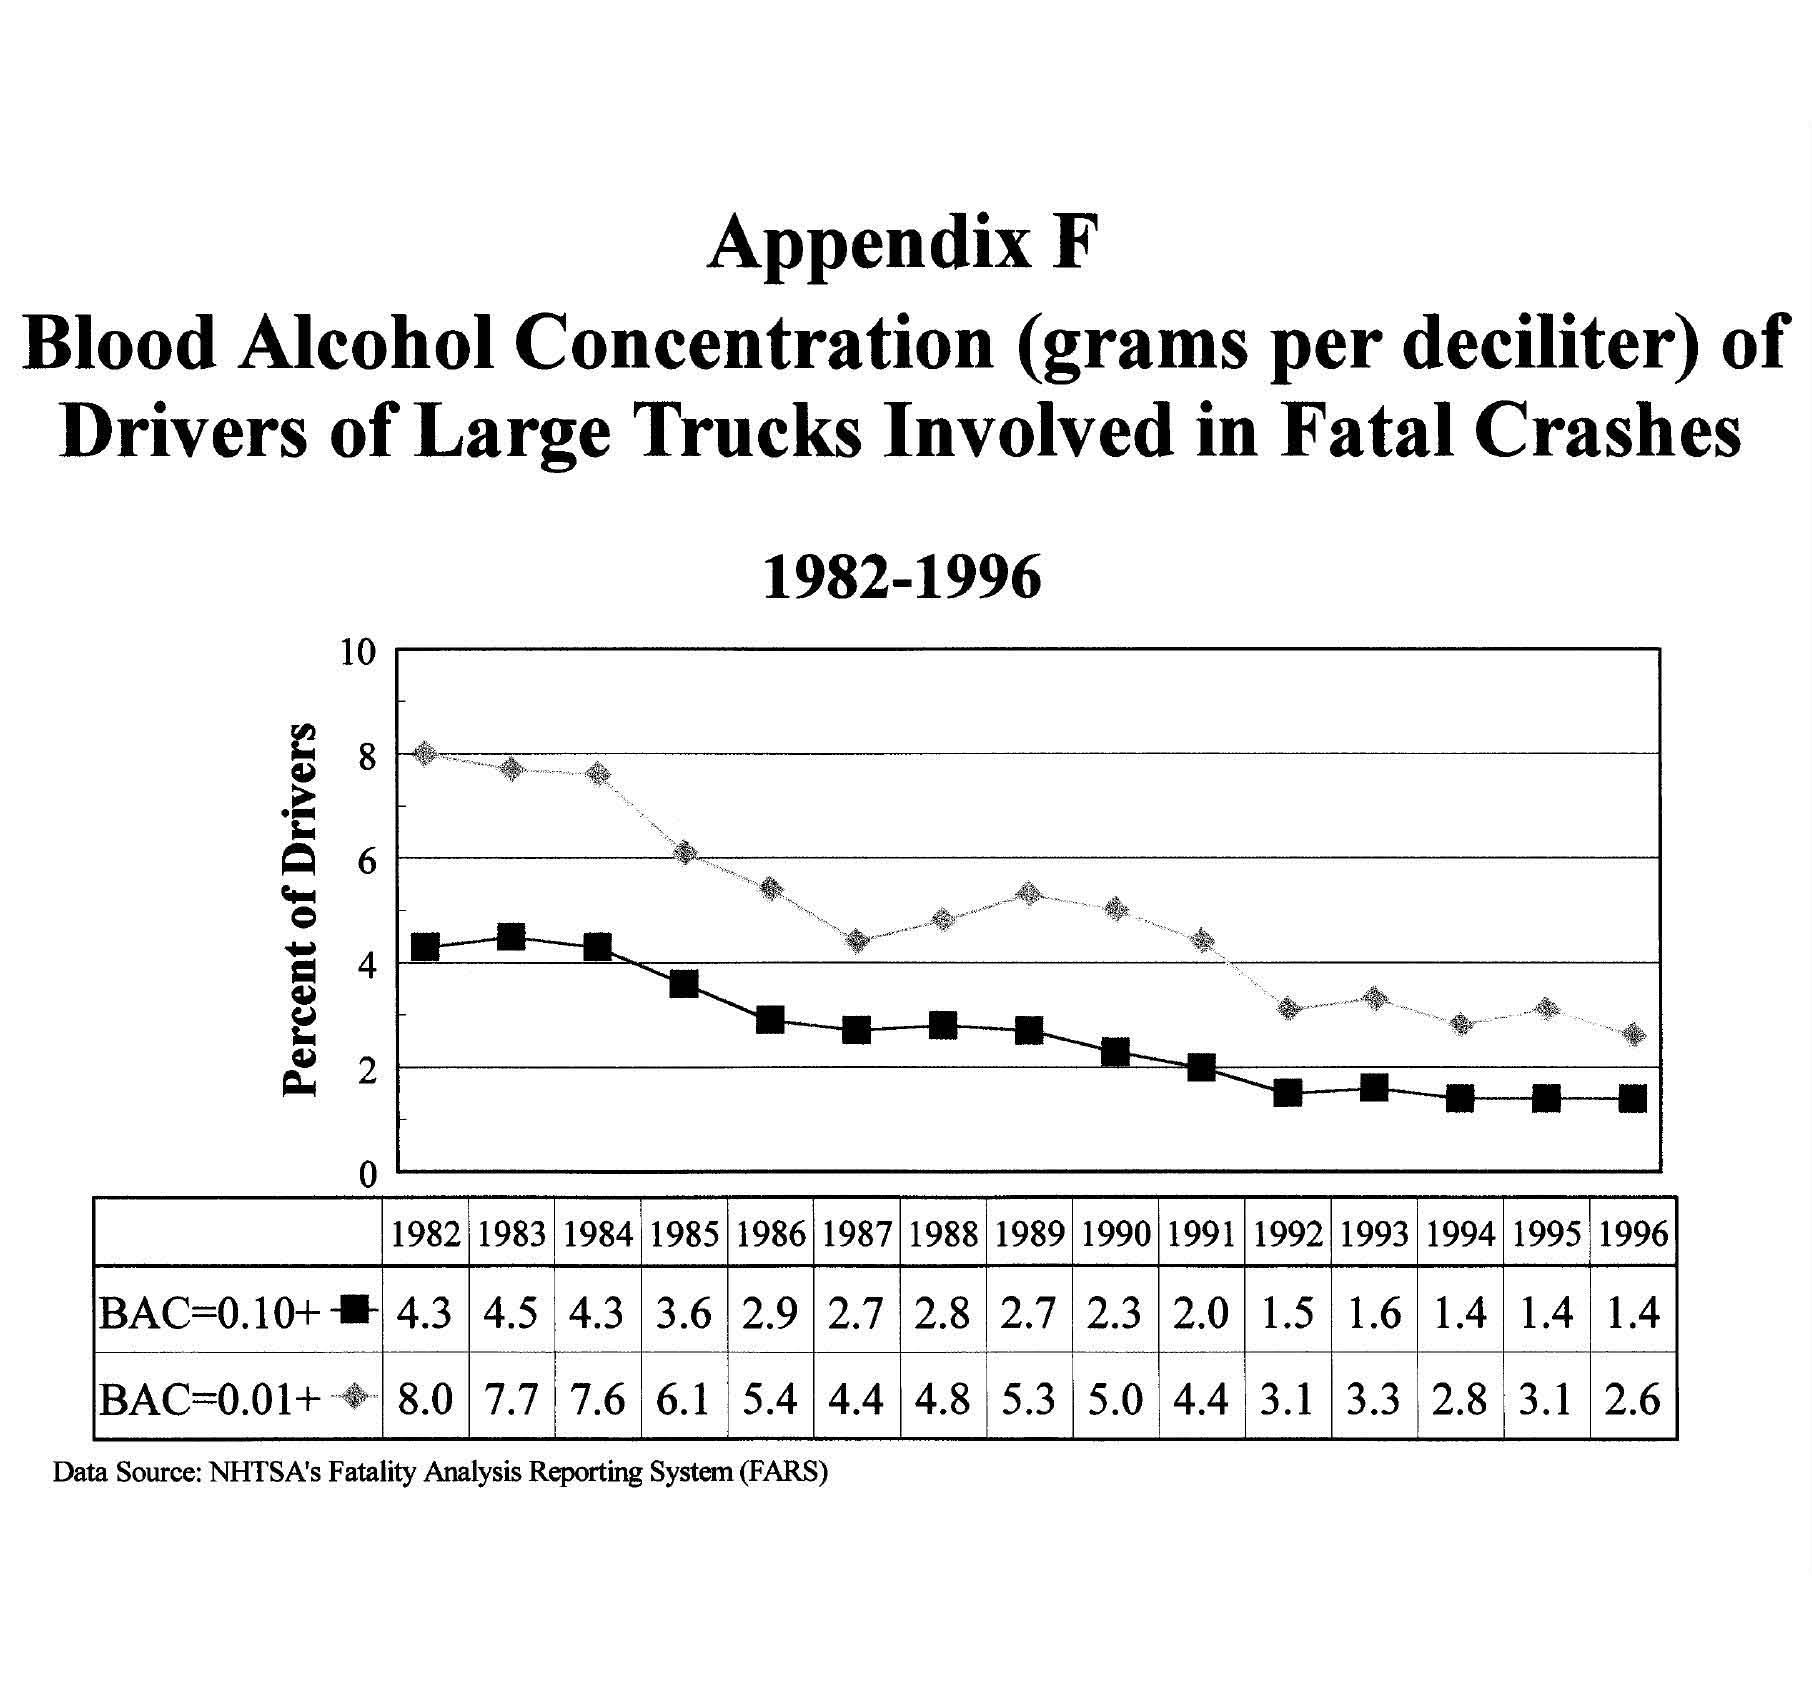
Third, the percentage of intoxicated truck drivers involved in
fatal crashes has fallen over the last ten years. The NHTSA's data for
1987 showed 2.7 percent of truck drivers involved in fatal crashes were
intoxicated, compared to 1.4 percent in 1996, a 52 percent decline.
This suggests to the FHWA that truck drivers use of alcohol may be
falling. See Appendix F for a graph showing the data.
Finally, the industry is promoting alcohol free driving through
educational material distributed by its associations. For example,
please refer to material such as the article ``Road Rage,'' in the
Owner Operator Independent Driver Association's ``Land Line'' Magazine,
November/December 1997 issue. The article suggests ten ``simple rules
of safe driving'' including the following rule.
``Don't drive when fatigued or under the influence of alcohol or
drugs. Many over the counter medicines can contain alcohol or other
ingredients that can affect your driving skills.''
This article is also available from OOIDA's internet universal
resource locator at http:\\www.ooida.com and http:\\www.landlinemag.com
[[Page 2174]]
Also refer to material available from the American Trucking
Associations, Inc. (ATA). ATA states one of its safety initatives is
alcohol and drug testing regulations. Some of ATA's material is
available on the internet, at http:\\www.truckline.com.
Will the Reduction of the Random Alcohol Testing Rate Reduce Any
Burdens in Collecting Information?
Yes, the FHWA will be sending a revised burden estimate to the
Office of Management and Budget (OMB) reflecting the savings.
On September 22, 1997, the OMB reapproved the collections of
information contained in the FHWA's controlled substances and alcohol
testing regulations. See FHWA Docket FHWA-97-2313. The OMB extended the
expiration date of its new approval until September 30, 2000. The OMB
approved an annual time burden to collect information of 57,479,400
hours and an annual financial burden to collect information of
$3,004,913,000. The costs to actually conduct the testing are much
higher than these information collection burdens.
Based upon the FHWA's reduction of the random alcohol testing rate
to ten percent of the average driver positions, the FHWA will submit to
OMB a request to lower the burden estimates to 57,169,400 hours and
$2,974,170,000. This is a savings of 310,000 burden hours and
$14,743,000 of financial burden each year to collect this information.
Appendix A--FHWA Calculations for the 1994 Positive Testing Rate
In 1995, the FHWA selected a stratified random sample of 1,048
motor carriers. Each selected motor carrier was mailed a request to
prepare and submit to the FHWA its calendar year 1994 controlled
substance testing data (the FHWA's alcohol testing regulations had not
yet taken effect). Five hundred forty-seven motor carriers responded to
the request. The strata were defined by the number of power units owned
by each motor carrier reported on the MCMIS. The sample size and
response rates, by strata, are shown in Table 2.
Table 2.--1994 Initial Responses Received
------------------------------------------------------------------------
No.
Strata (No. of power units) randomly No.
sampled responding
------------------------------------------------------------------------
1-19.............................................. 204 105
20-99............................................. 153 127
100-999........................................... 102 86
1000 or more...................................... 126 106
Unspecified *..................................... 459 123
---------------------
Total:.......................................... 1048 * * 547
------------------------------------------------------------------------
* The unspecified stratum includes motor carriers that have not provided
the FHWA's MCMIS with information about the number of CMV drivers who
work for them.
* * 551 responses were recevied, but 4 motor carrier responses failed to
report sufficient information to classify the motor carriers in any
stratum upon receipt of the report.
Nonrespondents
Four hundred ninety-seven of the 1,048 motor carriers contacted did
not respond. The FHWA made a number of efforts to contact these
nonrespondents. A second mailing and telephone contacts revealed the
vast majority of nonrespondents had legitimate reasons for not
returning the MIS forms. Many carriers were no longer in business, many
did not employ CDL drivers, some were exempt farmers, and others only
operated intrastate. Those nonresponding carriers that were determined
to be in business and within the scope of the survey were recontacted.
Drug and alcohol testing data from these carriers were then used to
adjust the rates in each sampling stratum. The adjustments are
described in Appendix D.
Estimation of the Random Positive Rate
The estimate of the rate of controlled substance use within the
motor carrier industry was carried out using two steps.
First, the initial estimates of the rate of controlled substance
use were made for each sampling stratum.
Second, the estimates were adjusted for nonresponse. All
information in the sample of nonrespondents showed zero positive rates
in that group. This means the estimates in the respondent groups were
adjusted downward by the rate of response. (See Appendix D.)
Results
Estimates of the rate of controlled substance use were made for the
industry as a whole and for the individual strata. The estimated rate
of controlled substance use in the motor carrier industry is (with a 95
percent confidence interval (CI)):
r=.026 (2.6%)
95% CI: (0.7%, 4.5%)
Appendix B--FHWA Calculations for the 1995 and 1996 Controlled
Substances Positive and Alcohol Violation Rates
I. Disposition of the 1995 Sample
For the 1995 survey, MIS forms were mailed to 1,747 motor carriers,
selected from a stratified random sample. Two hundred sixty-five
carriers required to conduct alcohol tests provided usable alcohol data
and 648 carriers provided usable controlled substance data. Information
on the disposition of the sample, by sampling stratum, is provided in
Table 3.
Table 3.-- Sample Sizes and Level of Response by Size Class
----------------------------------------------------------------------------------------------------------------
Respondents
Number of Viable Respondents providing
Size (CDL drivers) carriers on Total mail- sample providing controlled
sampling outs units alcohol substance
frame data data
----------------------------------------------------------------------------------------------------------------
Extra Large (1000 +)........................... 87 87 83 77 78
Large (100-999)................................ 953 150 145 126 137
Medium (50-99)................................. 1,029 100 95 62 82
Small (20-49).................................. 2,982 100 90 (NA) 80
Very Small (1-19).............................. 49,859 410 325 (NA) 152
Size Unknown................................... 99,069 900 592 (NA) 119
----------------------------------------------------------------
Total...................................... 153,979 1,747 1,330 265 648
----------------------------------------------------------------------------------------------------------------
[[Page 2175]]
Also listed in this table is response rate information by size
class stratum. The term Viable Sample Units refers to the number of
solicited sample units found to be in-business and in-scope (e.g., a
motor carrier with trucks over 11,794 kilograms gross vehicle weight
rating and at least one CDL driver). As can be seen from the table, the
FHWA found a large number of carriers selected for sample solicitation
from the MCMIS sampling frame to be non-viable. This was particularly
problematic for carriers selected from the ``size unknown'' size class
stratum, where only 66 percent of the original sample units selected
were found to be viable.
For the 1995 survey, intrastate carriers in the small size classes
(fewer than 50 CDL drivers) were not required to submit alcohol testing
information. Hence, the sample estimate for the alcohol usage rate is
based upon data from the three largest size classes only (50 or more
CDL drivers). In addition, data were excluded from the ``size unknown''
size class stratum for this estimate, since the FHWA believes most
carriers in this stratum are small companies.
Dividing the total number of sample units providing useable data by
the total number of viable units in the sample gives the response rate
for the survey. Using this approach for the sampling strata where data
were required, the response rate for the 1995 survey is 82 percent for
alcohol testing (based upon the three largest size classes where
reporting was required) and 49 percent for controlled substance testing
(based upon all size classes).
II. 1995 Survey Results
The survey estimate for the percentage of CDL drivers testing
positive for controlled substances is 2.8 percent, with an estimated
standard error of 0.46 percent. Based upon these results, a 95 percent
confidence interval for this estimate ranges from 1.9 percent to 3.7
percent (0.028, plus or minus the quantity 0.0046 times 2). Based on
statistical theory, if the survey were to be replicated, it would be
expected that the estimate for the percentage of CDL drivers testing
positive would fall within this range in 95 out of 100 surveys.
For the alcohol use, the survey estimate for the percentage of CDL
drivers testing 0.04 or greater alcohol concentration is 0.14 percent.
The estimated standard error for this estimate is 0.00018, thus giving
a 95 percent confidence interval for the estimate of 0.10 percent to
0.18 percent.
III. Disposition of the 1996 Sample
For the 1996 survey, MIS forms were mailed to almost 3,400 motor
carriers, selected from a stratified random sample. Two thousand seven
hundred carriers responded, of which 1,140 provided usable data. The
alcohol use rate from the 1996 survey includes data from both small and
large carriers, as all carriers were required to conduct random tests
in 1996. Information on the disposition of the sample, by sampling
stratum, is provided in Table 4.
Table 4.--Sample Sizes and Level of Response by Size Class
----------------------------------------------------------------------------------------------------------------
Number of
carriers on Total mail Viable Respondents
Size (CDL drivers) sampling outs sample providing
frame units data
----------------------------------------------------------------------------------------------------------------
Extra Large (1000 +)........................................ 96 96 93 81
Large (100-999)............................................. 1,324 300 293 258
Medium (50-99).............................................. 1,402 200 194 162
Small (20-49)............................................... 3,857 200 189 155
Very Small (1-19)........................................... 71,074 800 636 240
Size Unknown................................................ 103,036 1,800 1,296 246
---------------------------------------------------
Total................................................... 180,789 3,396 2,701 1,142
----------------------------------------------------------------------------------------------------------------
IV. 1996 Survey Results
The survey estimate for the percentage of CDL drivers testing
positive for controlled substances is 2.2 percent, with an estimated
standard error of 0.4 percent. Based upon these results, a 95 percent
confidence interval for this estimate ranges from 1.5 percent to 3.1
percent (0.022, plus or minus the quantity 0.004 times 2). Thus, if the
survey were to be replicated, statistical theory would suggest that the
estimate for the percentage of CDL drivers testing positive would fall
within this range in 95 out of 100 surveys.
For alcohol use, the survey estimate for the percentage of CDL
drivers testing 0.04 or greater alcohol concentration is 0.18 percent.
The estimated standard error for this estimate is 0.0003, thus giving a
95 percent confidence interval for the estimate of 0.12 percent to 0.24
percent.
Appendix C--Methodology for Estimating the Controlled Substances
Positive and Alcohol Violation Rates
The annual positive rate and its sampling error must be estimated
for the motor carrier industry. The estimation of the positive rate and
the sampling error must be based upon the samples of annual test
results. These estimates are based on a two-stage sampling design in
which the primary sampling units (motor carriers) are stratified on the
number of secondaries (i.e., CDL drivers) in each primary unit. This
stratification procedure helps to increase the precision of the survey
estimates.
When stratification is combined with simple subsampling and each
stratum is subsampled independently, an unbiased estimate of the
overall mean per secondary is given by a weighted mean (for L strata)
of the individual rates obtained for each stratum:
[GRAPHIC]
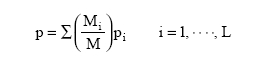
TR14JA98.000

where the summation is taken over the L strata and

p = overall mean per secondary (positive rate)
Mi = number of secondaries (i.e., CDL drivers) in the ith
stratum
M = total number of CDL drivers in the motor carrier industry
pi = the positive rate in the ith stratum

Estimation of the Sampling Variance
[GRAPHIC]
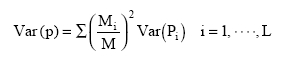
TR14JA98.001 where Var(Pi ) = is the sampling variance of the positive rates in each stratum Mi = number of secondaries (i.e., CDL drivers) in the ith stratum [[Page 2176]] M = total number of CDL drivers in the motor carrier industry The estimation of the sampling variance term, var (Pi ), is given as: [GRAPHIC]
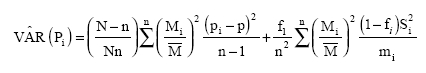
TR14JA98.002 where N=the total number of motor carriers in a stratum n=the number of motor carriers in the sample in the stratum f1 =n/N fi =the fraction of CDL drivers sampled in motor carrier i M=average number of CDL drivers for all motor carriers in a stratum Mi =the number of CDL drivers in the ith motor carrier selected pi =the positive rate in the ith motor carrier Appendix D--Estimating Stratum Rates With a Sample of Nonrespondents When a sample of nonrespondents is taken, an unbiased estimate of the positive rate is given as: p=tpr +(1-t)pnr where pr =the positive rate among the respondents pnr =the positive rate among the nonrespondents t=the estimated rate of response in the population (1-t=the estimated rate of nonresponse) The variance of this estimator is: Var=(1-)[S\2\+(g-1)(1-t)S o 2]/n where f=the sampling fraction of the original sample S\2\=the variance of p in the population So 2=the variance of p among the nonrespondents g=the inverse of the fraction on nonrespondent sampled t=response rate n=size of the original sample Appendix E--References for the Testing MIS Calculations Cochran, William G. (1977). ``Sampling Theory,'' Third edition, John Wiley & Sons, Inc., New York. Jessen, R.J. (1978). ``Statistical Survey Techniques,'' John Wiley & Sons, Inc., New York. Johnson, N.L. and S. Kotz (1969). ``Discrete Distributions,'' John Wiley & Sons, Inc., New York. Lessler, J.T. and W.D. Kalsbeek (1992). ``Nonsampling Error in Surveys,'' Wiley-Interscience, New York. Szameitat, K. and K. Schaeffer (1963). ``Imperfect Frames in Statistics and the Consequences for Their Use in Sampling,'' Bulletin of the International Statistical Institute (40) 517-544. Appendix F This appendix appears at the end of this document. (Authority: 49 U.S.C. 322, 31136, 31301 et seq.; 49 CFR 1.48) Issued on: December 29, 1997. Kenneth R. Wykle, Federal Highway Administrator. The following Appendix F contains a chart illustrating: Blood Alcohol Concentration (grams per decileter) of Drivers of Large Trucks Involved in Fatal Crashes, 1982-1996. BILLING CODE 4910-22-P [[Page 2177]] [GRAPHIC]
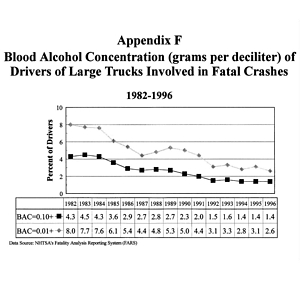 |
Appendix F: Blood Alcohol Concentration (grams per deciliter) of Drivers of Large Trucks Involved in Fatal Crashes
View BAC Chart, 165KB |
TR14JA98.003


[FR Doc. 98-566 Filed 1-13-98; 8:45 am]
BILLING CODE 4910-22-C