

Traffic Tech #192: Natinal Survey of Drinking and Driving Documents Attitudes and Behaviors in 1997 |
|---|
|

NATIONAL SURVEY OF DRINKING AND DRIVING DOCUMENTS ATTITUDES AND BEHAVIORS IN 1997
Since 1991, the National Highway Traffic Safety Administration (NHTSA) has conducted a telephone survey every two years to measure the status of attitudes, knowledge, and behavior of the general driving age public about drinking and driving. These surveys measure various topics including the reported frequency of drinking and driving, prevention and intervention, riding with impaired drivers, designated drivers, perceptions of penalties and enforcement, knowledge of BAC levels, and alcohol-impaired crashes. (See Traffic Techs 89 and 135).
The 1997 survey interviewed a nationally representative sample of 4,010 persons aged 16 or older in the United States between October 12 and December 12, 1997. The proportion of the population who reported driving within two hours of drinking in the past year declined from 28 percent in 1991, to 24 percent in 1993 and 1995, and remains constant at 24 percent in 1997. The proportion of people who put themselves at risk by riding with a potentially impaired driver declined between 1993 and 1995, and in 1997, remains near the 1995 level of 11 percent. The driving age public sees drinking and driving as a major threat to their personal safety (79 percent) and 86 percent feel it is very important to do something to reduce the problem.
The perceptions that current laws and penalties for reducing drinking and driving are very effective has held steady since 1993 at 11 percent, while the proportion saying they are somewhat effective has increased from 48 percent in 1993 to 53 percent in 1997. Support for increased use of sobriety check points increased slightly since 1993 from 64 to 68 percent in 1997. More persons between the ages of 16 and 64 are aware of BAC levels than in 1995 (84 percent, up from 79 percent in 1995), but, less than one-third correctly know the BAC limit in their state. This is an improvement -- 29 percent now, up from 20 percent in 1995. Almost six in ten (56 percent) who are aware of BAC levels support a BAC of .08 or stricter for their state, with 80 percent of those in current .08 states supporting this limit.

Drinking and Driving Behavior
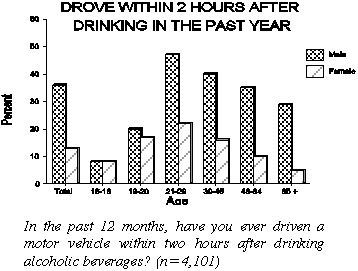
Males are almost three times as likely as females (36 vs 13 percent) to have driven within 2 hours of drinking. Adults aged 21 to 29 are the most likely to be drinking drivers. On average, they consume 2.5 drinks before driving, and do so over a four hour period. Drinking drivers drive within about 46 minutes after consuming their last drink.
Riding with Drinking Drivers
One in ten (10 percent) has ridden with a driver they thought may have consumed too much alcohol to drive safely. This rises to 14 percent among those aged 21 to 29, and 23 percent for those age 16-20. Six in ten riders decided that their drivers were unsafe before they were riding in the vehicle.
Designated Drivers
About 40 percent of the drivers who consume alcoholic beverages report at least one occasion where they refrained from driving when they thought they may have been impaired. Most rode with another driver instead. One-third have ridden with a designated driver in the past year, with those under age 30 about twice as likely to have done so. Three in ten drivers have acted as a designated driver in the past year. Designated drivers reported to have consumed less than one half of one alcoholic drink, on average, before driving.
Estimated Total Yearly Drinking Driving Trips
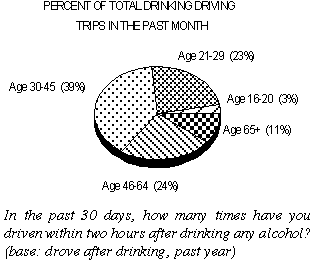
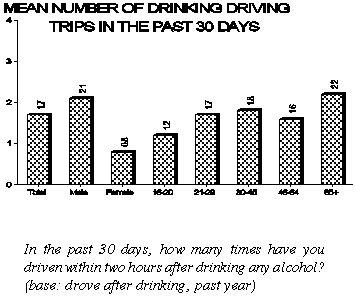
Drinking drivers in their 20's, while the most likely to report any drinking driving trips, account for only about one in five of all drinking driving trips. About four in ten of all past year drinking driving trips were made by those aged 30 to 45. Using the past 30 day measure, the total number of drinking driving trips was calculated for each respondent, and expanded to the population at large. Overall, past year drinking drivers made an estimated 811 million to 1.1 billion drinking driving trips in the past year, with males making about 90 percent of the total. Problem drinkers are estimated to account for 283 to 479 million drinking driving trips in 1997, or about 40 percent of all trips. The next chart shows the average number of trips per month by age.


HOW TO ORDER
For a copy of National Survey of Drinking and Driving Attitudes and Behavior, 1997, prepared by the Gallup Organization, write to the Office of Research and Traffic Records, NHTSA, NTS-31, 400 Seventh Street, S.W., Washington, DC 20590, or send a fax to (202) 366-7096. Paul J. Tremont Ph.D., was the contract manager for this project, email ptremont@nhtsa.dot.gov
U.S. Department
of Transportation
National Highway
Traffic Safety
Administration
400 Seventh Street, S.W. NTS-31
Washington, DC 20590
Traffic Tech is a publication to disseminate
information about traffic safety programs,
including evaluations, innovative programs,
and new publications. Feel free to copy it as you wish.
If you would like to receive a copy contact:
Linda Cosgrove, Ph.D., Editor, Evaluation Staff
Traffic Safety Programs
(202) 366-2759, fax (202) 366-7096
mailto:lcosgrove@nhtsa.dot.gov
