

Traffic Tech #191: Standard enforcement Saves Lives the Case for Strong Seat Belt Laws |
|---|
|

STANDARD ENFORCEMENT SAVES LIVES THE CASE FOR STRONG SEAT BELT LAWS
It's a fact. On American's roads, someone is killed every 13 minutes and someone is injured every nine seconds in traffic crashes. It takes only a few seconds to fasten a seat belt. Yet this simple action, repeated every time you get into a motor vehicle, may be the most significant driving related behavior change you can make to protect your life and the wellbeing of those you care about. The buckle up habit dramatically increases your chance of surviving a crash. It's the best weapon against a drunk, tired, or aggressive driver.

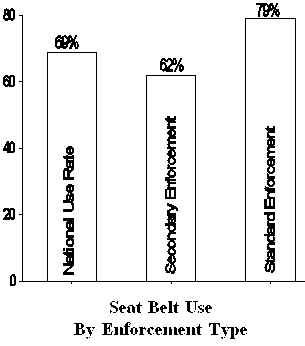
Seat belt use was very low, only 10-15 percent nationwide, until the early 1980s. Due in part to the passage of seat belt use laws in 31 states, belt use increased from 14 to 42 percent from 1984 through 1987. From 1990 through 1992, belt use rose from 49 percent to 62 percent, attributable, in part, to a national effort of highly visible seat belt law enforcement and public education.
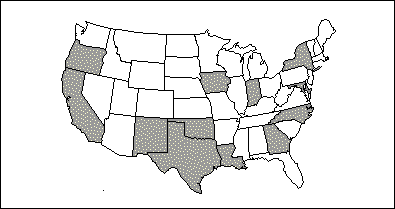
States that have standard enforcement seat belt laws have higher seat belt use rates. The average seat belt use rate in these states is 17 percentage points higher than in states with secondary enforcement laws. Standard enforcement allows a police officer to stop a vehicle and issue a citation when the officer observes an unbelted driver or passenger. Secondary enforcement means a citation can only be written after the officer stops the vehicle for another infraction. Safety belt use laws are the only laws in America that make a distinction between standard (also called primary) and secondary enforcement. Virtually all traffic safety laws -- and other laws, for that matter -- are standard, except secondary enforcement safety belt use laws. In states with secondary laws, a police officer can stop a motorist for a burnt out taillight or an expired license tag, but cannot stop a motorist for violating the state's seat belt law.

Standard enforcement enhances the perceived importance of the seat belt law with both the public and the police and ultimately leads to greater compliance. Standard enforcement also sends a clear message that the state considers seat belt use mandatory for the safe operation of a motor vehicle.
Standard Enforcement Saves Lives: The Case for Strong Seat Belt Laws is a 36 page booklet that presents information about how effective seat belts are in reducing injuries and deaths and how best to encourage everyone to buckle up on every trip.
HOW TO ORDER
Write to Media and Marketing Division, NHTSA, NTS-21, 400 Seventh Street, S.W., Washington, DC 20590, or send a fax to (202) 366-2727.
Economic Savings. Annual estimates in 1997 dollars, based on estimated 15 percentage point increase in seat belt use. The potential increases in states with usage rates of 71 percent are "capped" at 85 percent.
| State | Deaths Prevented | Savings from Deaths Prevented | Injuries Prevented | Savings from Injuries Prevented | Total Savings |
|---|---|---|---|---|---|
| Alabama | 99 | $73,094,145 | 1300 | $35,055,356 | $108,149,501 |
| Alaska | 7 | $6,647,284 | 86 | $3,316,981 | $9,964,286 |
| Arizona | 70 | $54,110,839 | 1457 | $42,556,191 | $96,667,030 |
| Arkansas | 50 | $34,446,707 | 1051 | $26,465,081 | $60,911,788 |
| Colorado | 51 | $47,151,250 | 1138 | $39,137,083 | $86,288,332 |
| Delaware | 9 | $7,923,039 | 164 | $5,702,998 | $13,626,036 |
| Florida | 207 | $184,061,832 | 4906 | $163,433,287 | $347,495,119 |
| Idaho | 22 | $16,463,244 | 326 | $9,048,737 | $25,511,980 |
| Illinois | 124 | $120,596,775 | 3894 | $140,163,891 | $260,760,667 |
| Kansas | 45 | $38,391,856 | 995 | $31,239,743 | $69,631,599 |
| Kentucky | 73 | $53,194,671 | 1428 | $38,506,870 | $91,701,541 |
| Maine | 14 | $11,330,233 | 344 | $10,082,076 | $21,412,309 |
| Massachusetts | 27 | $27,788,589 | 1557 | $58,118,613 | $85,907,202 |
| Michigan | 149 | $133,324,905 | 3588 | $123,496,414 | $256,821,320 |
| Minnesota | 54 | $49,503,658 | 1174 | $40,147,314 | $89,650,973 |
| Mississippi | 65 | $41,632,633 | 907 | $20,789,235 | $62,421,868 |
| Missouri | 113 | $94,520,336 | 2407 | $76,382,949 | $170,903,284 |
| Montana | 20 | $14,497,748 | 225 | $6,698,042 | $21,195,790 |
| Nebraska | 30 | $25,006,211 | 749 | $24,177,562 | $49,183,773 |
| Nevada | 33 | $32,302,520 | 666 | $25,808,285 | $58,110,806 |
| New Hampshire | 9 | $8,868,192 | 234 | $8,059,966 | $16,928,158 |
| New Jersey | 60 | $68,503,201 | 3041 | $127,175,074 | $195,678,276 |
| North Dakota | 7 | $5,193,556 | 132 | $3,598,896 | $8,792,452 |
| Ohio | 126 | $107,336,899 | 4948 | $155,091,334 | $262,428,233 |
| Pennsylvania | 134 | $122,163,931 | 3111 | $108,308,900 | $230,472,830 |
| Rhode Island | 4 | $4,200,174 | 187 | $6,091,039 | $10,291,213 |
| South Carolina | 78 | $56,595,318 | 1328 | $35,739,018 | $92,334,337 |
| South Dakota | 16 | $12,177,601 | 230 | $6,529,243 | $18,706,844 |
| Tennessee | 120 | $95,320,856 | 2181 | $65,322,761 | $160,643,616 |
| Utah | 27 | $19,008,432 | 626 | $16,759,200 | $35,767,632 |
| Vermont | 8 | $ 6,915,677 | 99 | $ 3,099,303 | $10,014,980 |
| Virginia | 85 | $78,583,710 | 2019 | $71,709,645 | $150,293,355 |
| Washington | 17 | $16,014,446 | 456 | $17,393,954 | $33,408,400 |
| West Virginia | 30 | $20,875,794 | 573 | $15,093,813 | $35,969,607 |
| Wisconsin | 70 | $59,313,311 | 1754 | $55,404,881 | $114,718,192 |
| Wyoming | 11 | $9,175,916 | 122 | $4,122,289 | $13,288,205 |
| TOTAL | 2,046 | $1,756,235,489 | 49,402 | $1,619,816,023 | $3,376,051,513 |
U.S. Department
of Transportation
National Highway
Traffic Safety
Administration
400 Seventh Street, S.W. NTS-31
Washington, DC 20590
Traffic Tech is a publication to disseminate
information about traffic safety programs,
including evaluations, innovative programs,
and new publications. Feel free to copy it as you wish.
If you would like to receive a copy contact:
Linda Cosgrove, Ph.D., Editor, Evaluation Staff
Traffic Safety Programs
(202) 366-2759, fax (202) 366-7096
mailto:lcosgrove@nhtsa.dot.gov
